Debugging
“Debugging is twice as hard as writing the code in the first place. Therefore, if you write the code as cleverly as possible, you are, by definition, not smart enough to debug it.” – Brian Kernighan
Overview
Are you one of those programmers who fills their code with print
statements when trying to debug their programs?
Hey, we all used to do that.
(OK, sometimes we still do that…)
But once you start writing larger programs you’ll need a better system.
Debugging tools for Python vary across platforms, IDEs and editors.
Here we’ll focus on Jupyter and leave you to explore other settings.
We’ll need the following imports
import numpy as np
import matplotlib.pyplot as plt
%matplotlib inline
Debugging
The debug Magic
Let’s consider a simple (and rather contrived) example
def plot_log():
    fig, ax = plt.subplots(2, 1)
    x = np.linspace(1, 2, 10)
    ax.plot(x, np.log(x))
    plt.show()

plot_log()  # Call the function, generate plot
---------------------------------------------------------------------------
AttributeError                            Traceback (most recent call last)
<ipython-input-2-c32a2280f47b> in <module>
      5     plt.show()
      6
----> 7 plot_log()  # Call the function, generate plot

<ipython-input-2-c32a2280f47b> in plot_log()
      2     fig, ax = plt.subplots(2, 1)
      3     x = np.linspace(1, 2, 10)
----> 4     ax.plot(x, np.log(x))
      5     plt.show()
      6

AttributeError: 'numpy.ndarray' object has no attribute 'plot'

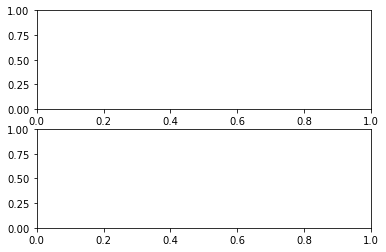
This code is intended to plot the log function over the interval
\([1, 2]\).
But there’s an error here: plt.subplots(2, 1) should be just
plt.subplots().
(The call plt.subplots(2, 1) returns a NumPy array containing two axes
objects, suitable for having two subplots on the same figure)
The traceback shows that the error occurs at the method call
ax.plot(x, np.log(x)).
The error occurs because we have mistakenly made ax a NumPy array, and
a NumPy array has no plot method.
But let’s pretend that we don’t understand this for the moment.
We might suspect there’s something wrong with ax but when we try to
investigate this object, we get the following exception:
ax
---------------------------------------------------------------------------
NameError                                 Traceback (most recent call last)
<ipython-input-3-b00e77935981> in <module>
----> 1 ax

NameError: name 'ax' is not defined
The problem is that ax was defined inside plot_log(), and the name
is lost once that function terminates.
Let’s try doing it a different way.
We run the first cell block again, generating the same error
def plot_log():
    fig, ax = plt.subplots(2, 1)
    x = np.linspace(1, 2, 10)
    ax.plot(x, np.log(x))
    plt.show()

plot_log()  # Call the function, generate plot
---------------------------------------------------------------------------
AttributeError                            Traceback (most recent call last)
<ipython-input-4-c32a2280f47b> in <module>
      5     plt.show()
      6
----> 7 plot_log()  # Call the function, generate plot

<ipython-input-4-c32a2280f47b> in plot_log()
      2     fig, ax = plt.subplots(2, 1)
      3     x = np.linspace(1, 2, 10)
----> 4     ax.plot(x, np.log(x))
      5     plt.show()
      6

AttributeError: 'numpy.ndarray' object has no attribute 'plot'
But this time we type in the following cell block
%debug
You should be dropped into a new prompt that looks something like this
ipdb>
(You might see pdb\> instead)
Now we can investigate the value of our variables at this point in the program, step forward through the code, etc.
For example, here we simply type the name ax to see what’s happening
with this object:
ipdb> ax
array([<matplotlib.axes.AxesSubplot object at 0x290f5d0>,
       <matplotlib.axes.AxesSubplot object at 0x2930810>], dtype=object)
It’s now very clear that ax is an array, which clarifies the source
of the problem.
To find out what else you can do from inside ipdb (or pdb), use the
online help
ipdb> h

Documented commands (type help <topic>):
========================================
EOF    bt         cont      enable  jump  pdef   r        tbreak   w
a      c          continue  exit    l     pdoc   restart  u        whatis
alias  cl         d         h       list  pinfo  return   unalias  where
args   clear      debug     help    n     pp     run      unt
b      commands   disable   ignore  next  q      s        until
break  condition  down      j       p     quit   step     up

Miscellaneous help topics:
==========================
exec  pdb

Undocumented commands:
======================
retval  rv

ipdb> h c
c(ont(inue))
Continue execution, only stop when a breakpoint is encountered.
Setting a Break Point
The preceding approach is handy but sometimes insufficient.
Consider the following modified version of our function above
def plot_log():
    fig, ax = plt.subplots()
    x = np.logspace(1, 2, 10)
    ax.plot(x, np.log(x))
    plt.show()

plot_log()
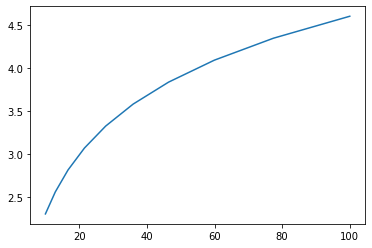
Here the original problem is fixed, but we’ve accidentally written
np.logspace(1, 2, 10) instead of np.linspace(1, 2, 10).
Now there won’t be any exception, but the plot won’t look right.
To investigate, it would be helpful if we could inspect variables like
x during execution of the function.
To this end, we add a “break point” by inserting breakpoint() inside
the function code block
def plot_log():
    breakpoint()
    fig, ax = plt.subplots()
    x = np.logspace(1, 2, 10)
    ax.plot(x, np.log(x))
    plt.show()

plot_log()
Now let’s run the script, and investigate via the debugger
> <ipython-input-6-a188074383b7>(6)plot_log()
-> fig, ax = plt.subplots()
(Pdb) n
> <ipython-input-6-a188074383b7>(7)plot_log()
-> x = np.logspace(1, 2, 10)
(Pdb) n
> <ipython-input-6-a188074383b7>(8)plot_log()
-> ax.plot(x, np.log(x))
(Pdb) x
array([ 10.        ,  12.91549665,  16.68100537,  21.5443469 ,
        27.82559402,  35.93813664,  46.41588834,  59.94842503,
        77.42636827, 100.        ])
We used n twice to step forward through the code (one line at a time).
Then we printed the value of x to see what was happening with that
variable.
To exit from the debugger, use q.